
Welcome to another exciting post on our blog! If you're a baseball enthusiast or a budding fan of the game, you've probably encountered various baseball statistics. One of the most fundamental stats you'll come across is the Batting Average or BA. The beauty of baseball lies in its details, and understanding these details, like BA, enhances our appreciation of the sport. In this blog post, we'll uncover what BA means, why it matters, and the role it plays in this great game. Let's step up to the plate and dive into the fascinating world of baseball averages!
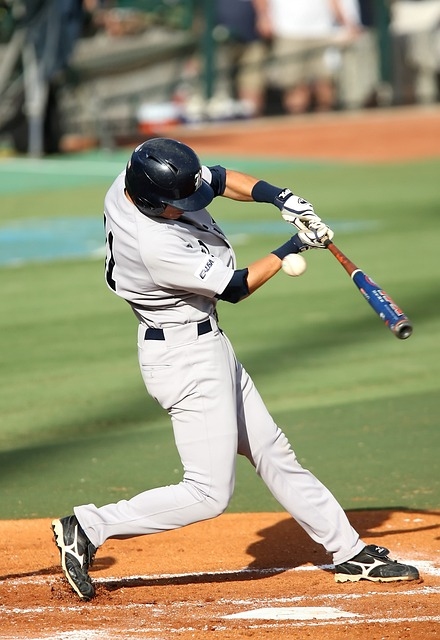
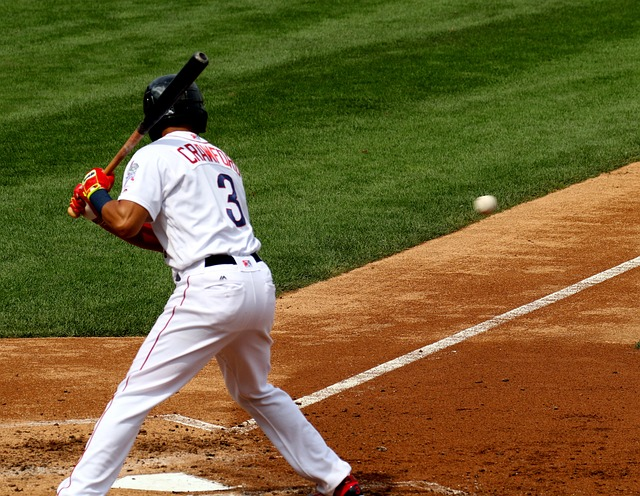
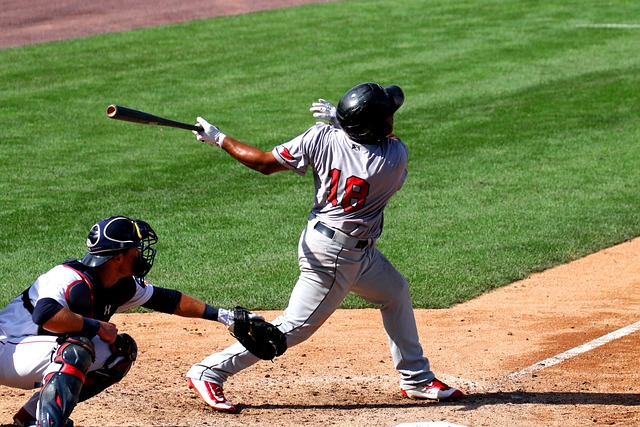
Batting average, symbolized as BA or AVG, is one of the oldest statistics in baseball. It's a straightforward measure that tells us how often a batter gets a hit. The formula is quite simple: BA is calculated by dividing the total number of a player's hits by their total at bats. It's represented as a three-digit decimal but it's referred to as if it's out of 1,000. So, a batting average of .300 is commonly referred to as "three hundred."
Let's clarify what we mean by 'hits' and 'at bats'. A 'hit' in baseball is when a batter strikes the ball and reaches at least first base without the help of an error or a fielder's choice. On the other hand, 'at bats' or AB, refers to the number of times a batter has a chance to hit the ball during a game, excluding walks, sacrifices, interference, or obstruction.
Let's take an example to calculate batting average. If a player has 20 hits and 50 at bats, the batting average would be .400, calculated as: 20 (hits) ÷ 50 (at bats) = .400. Simple, isn't it?
Please note that a batting average of .400 is outstanding and very rare in modern major leagues. The last player to hit .400 in a season was Ted Williams of the Boston Red Sox, who achieved this feat in 1941. But don't worry, you don't need a .400 BA to be a good hitter. In fact, a batting average of .300 is generally considered excellent in Major League Baseball.
Let's take a breather here. In the next section, we will dive into how BA can help evaluate a player's performance and its significance in the world of baseball.
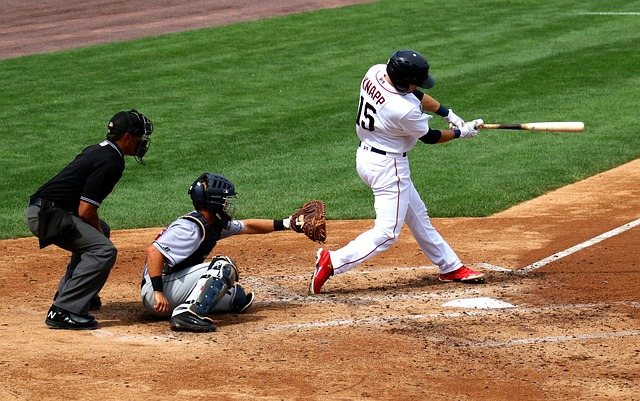
Let's swing into the nitty-gritty of why batting average matters. As we mentioned earlier, BA is a significant stat in baseball because it measures a player's ability to successfully hit the ball and reach base. This is crucial because, well, the name of the game is hitting the ball! A higher batting average means the player hits the ball successfully more often during their at bats. This ability is vital for a player's success and their value to the team.
However, let's not forget that baseball is a complex sport. A player's batting average doesn't tell the whole story. While BA provides a fundamental measure of a batter's skill, it doesn't account for the quality of the hits. For example, a player who hits lots of doubles or home runs but has a lower average might be more valuable than a player with a high batting average but only hits singles. It's important to consider other baseball statistics like slugging percentage and on base percentage for a complete picture.
That's where the concept of a player's 'slash line' comes in. This is a series of three numbers: the player's batting average, on base percentage (OBP), and slugging percentage (SLG). Together, these three figures provide a comprehensive view of a player's hitting abilities.
Furthermore, various other factors can impact a player's batting average. These include the player's position in the batting order, the ballpark's dimensions, the quality of opposing pitchers, and even the weather! Hence, while a great batting average is undoubtedly a good sign, it's essential to take these other factors into account when evaluating a player's performance.
One fascinating piece of trivia: did you know about the Mendoza Line? It's an informal term coined by baseball players, named after Mario Mendoza, a shortstop in the Major Leagues known for his excellent fielding skills but poor batting average. A player's batting average is said to be below the Mendoza Line if it falls under .200. While it's used in a somewhat teasing manner, it's another example of the relevance of batting averages in professional baseball.
That sums up our exploration of the role of batting averages in evaluating player performance. Next up, we'll step into the time machine and look at the history of batting averages in Major League Baseball.
The beauty of baseball, beyond the crack of the bat and the thrill of a home run, is in its rich history, and the batting average is an integral part of that. The concept of the batting average was developed by an English statistician, Henry Chadwick, in the 19th century. Chadwick, who was a cricket journalist initially, adapted the idea to baseball. And ever since, batting averages have played a pivotal role in baseball statistics.
Let's take a stroll down the annals of Major League Baseball history and see some of the significant moments related to batting averages. In the early years of the league, it was not uncommon to see players with a very high batting average. For instance, Hugh Duffy of the Boston Red Sox holds the record for the highest single-season average in Major League Baseball history with a remarkable .440 in the 1894 season.
However, as the sport evolved and pitching improved, batting averages declined in the live ball era. This drop in averages became so severe that 1968 came to be known as the "Year of the Pitcher," with the league-wide batting average falling to just .237!
In response, Major League Baseball lowered the pitcher's mound and shrank the strike zone the following year, which helped to increase the batting average across the league. Today, a batting average above .300 is considered outstanding.
On the topic of career batting averages, Ty Cobb of the Detroit Tigers holds the record for the highest career batting average in Major League history. Cobb, a member of the Baseball Hall of Fame, ended his illustrious 24-year career with a batting average of .366.
It's worth noting that the highest batting averages are usually found among non-pitchers. In recent years, there's been a trend in the major leagues to exclude pitchers when calculating team batting averages, as pitchers generally have lower averages than position players.
That's a wrap for our journey through the history of batting averages. In the next section, we'll touch on some of the most remarkable batting averages in Major League history, which will include some unforgettable players and memorable seasons.
Grab your scorecards, baseball fans, because we're about to delve into the awe-inspiring figures and stories behind the highest batting averages in Major League Baseball history.
Let's start with a name that no fan of baseball could forget, Ty Cobb. Nicknamed "The Georgia Peach," Cobb played 22 seasons for the Detroit Tigers and two for the Philadelphia Athletics. His career batting average of .366 remains the highest in Major League Baseball history, a record that has stood for almost a century.
However, even the legendary Ty Cobb couldn't beat Hugh Duffy's record for the highest single season average. As I mentioned in the previous section, Duffy achieved an astounding .440 average with the Boston Red Sox in 1894. To put that into perspective, achieving such an average would mean that a player would have to get a hit nearly half the time they had an at bat!
It's also worth noting the extraordinary feat of Nap Lajoie. Lajoie, playing for the Philadelphia Phillies in 1901, won the American League batting title with an average of .426, the highest ever for a player in the modern era (since 1901).
There are more recent examples, too, of players with standout batting averages. For instance, Tony Gwynn, who spent his entire career with the San Diego Padres, won an impressive eight batting titles and ended his career with a batting average of .338, one of the highest in the modern era.
Ted Williams, the legendary Boston Red Sox left fielder, also deserves a special mention. Williams was the last player to hit .400 in a season, ending the 1941 season with a batting average of .406. This achievement is all the more remarkable considering it's been over 80 years, and no player has been able to repeat the feat.
Now, let's spare a thought for our pitchers too. It's a well-known fact that pitchers usually don't have high batting averages, but there are always exceptions. Wes Ferrell, for instance, holds the record for the highest career batting average for a pitcher at .280. Plus in the game today, Shohei Ohtani, the first two way phenom since Babe Ruth is hitting .268 for his career with 143 home runs and as a pitcher a 2.96 career ERA.
We've covered a lot of ground here, discussing some of the most remarkable batting averages in Major League history. In our next section, we'll shift gears and look at how batting averages are calculated. A little math never hurt anybody, right?
After journeying through the illustrious history of batting averages, let's get to the nuts and bolts of how to calculate batting average. Don't worry, even though it involves a bit of math, the process is actually quite straightforward.
The formula for calculating a player's batting average is simple: It's the number of hits divided by the number of at bats. In other words, it represents how often a player gets a base hit when they are at bat.
So, let's say a player has had 500 at bats in a season and managed to get a hit 150 times. To calculate their batting average, you would divide the number of hits (150) by the number of at bats (500). The result is 0.300. That's a .300 batting average, which is considered a good batting average in Major League Baseball.
It's important to note a few things here. Firstly, the average is usually written to three decimal places. So, you won't see a batting average of .3 or .30; it's always written as .300. Secondly, despite it being a decimal, it is referred to as a "percentage." So, a player with a batting average of .300 is said to be "batting three hundred," not "batting point three."
One key aspect to remember is what counts as an at bat. Officially, an at bat is a plate appearance in which the batter does not walk, get hit by a pitch, hit a sacrifice bunt or fly, or reach base due to an error or a fielder's choice. These outcomes are not considered at bats because the batter did not have an opportunity to get a hit.
Let me give you an example. Suppose a player has 600 plate appearances in a season. Of those, 80 were walks, 10 were hit by pitches, and 10 were sacrifice bunts or flies. This player would have a total of 500 at bats (600 plate appearances - 80 walks - 10 hit by pitches - 10 sacrifices).
Lastly, when calculating batting averages, always remember that the result is rounded to three digits after the decimal point. So, if the precise average would be .2995, it gets rounded to .300.
That's all there is to it! Now, you have the knowledge to calculate batting averages like a pro. In the next section, we'll examine the significance of batting average in the wider context of baseball statistics.
Having dug deep into what batting average is and how it's calculated, we're ready to position this stat within the broader framework of baseball statistics. Understanding the context will help you appreciate the game even more, as numbers tell stories and paint vivid pictures of player performance and team dynamics.
A player's batting average is undeniably important, but it's only a piece of the statistical puzzle in baseball. If you remember, the formula for batting average does not account for walks or extra base hits. Consequently, it might not fully capture a player's offensive contribution. That's where other statistics like on-base percentage (OBP) and slugging percentage (SLG) come into play.
On-base percentage considers how frequently a player reaches base, whether it's by a hit, a walk (base on balls), or getting hit by a pitch. A player who frequently walks can have a low batting average but a high on-base percentage, proving valuable to their team by becoming a frequent base runner. In our stat sheet, this helps illustrate a player's ability to avoid making outs, a crucial skill in baseball.
Slugging percentage, on the other hand, takes into account the total number of bases a player reaches per at bat. Unlike batting average, it considers the value of extra-base hits like doubles, triples, and home runs. A player with a lot of extra base hits will have a high slugging percentage, indicating that they're not just getting hits, but they're getting valuable hits that can lead to more runs scored.
Together with batting average, these three stats form a player's slash line (BA/OBP/SLG), providing a more complete picture of their offensive performance. For instance, a slash line of .300/.380/.500 would indicate a batting average of .300, an on-base percentage of .380, and a slugging percentage of .500.
While batting average tells us a lot, it's clear it doesn't tell us everything. Batting averages, like most statistics in baseball, are most valuable when used in conjunction with other measures. Batting average remains one of the most widely recognized stats in baseball and holds historical significance. It gives a quick snapshot of a hitter's success rate at the plate, but there's always more to the story.
In the next section, we'll explore the debates and controversies around the use of batting average as a primary measure of hitting success.
One of the reasons we love statistics in baseball is because they help us connect different eras of the sport, linking current players to the legends of the past. Let's continue our exploration of the batting average by taking a closer look at some of the highest and lowest averages in Major League Baseball history. It's time for a bit of a history lesson with a statistical twist.
Let's start on a high note, shall we? The record for the highest career batting average in Major League history is held by none other than Ty Cobb. Known as "The Georgia Peach," Cobb had a career batting average of .366 over his illustrious 24-year career with the Detroit Tigers and the Philadelphia Athletics.
There's an exclusive club in MLB history - the .400 club, reserved for those who achieved a batting average of .400 or more in a single season. The last person to reach this lofty height was Ted Williams, who batted .406 for the Boston Red Sox in 1941, a feat that has not been replicated since.
On the other end of the spectrum, let's talk about the "Mendoza Line" again. While the term is named after Mario Mendoza, he actually finished his career with a batting average of .215, above the .200 line that his name has come to represent. Bill Bergen, a catcher who played in the early 1900s, holds the record for the lowest career batting average for a non-pitcher, finishing with a .170 average over his 11-year career.
But what about more recent times, I hear you ask? Well, the game has seen some fluctuations in league-wide batting averages over the decades. For instance, the league-wide batting average in the 2000s was generally higher than in the 1960s. The reason? Many factors contribute to such changes, including but not limited to adjustments in pitching, changes in the ballparks, and evolution of the players' hitting approaches.
Today, a batting average of .300 is generally considered a benchmark for excellent performance, while an average below .250 is often seen as below-average for a regular starter. However, these standards can vary depending on other factors like position played, power hitting, and defensive skills.
In the final section, I'll wrap things up by sharing some resources where you can dive deeper into the world of baseball statistics.
Congratulations! If you've made it this far, you've learned a ton about the batting average, one of baseball's most iconic statistics. But our journey doesn't have to end here. There are plenty of resources out there for you to continue exploring the world of baseball statistics.
For those of you who are interested in diving deeper into the numbers, there are several online resources that are worth checking out. Websites like Baseball-Reference and FanGraphs offer a wealth of data on Major League Baseball, including detailed batting statistics. You can search for players' career batting averages, season-by-season records, league averages, and much more.
And if you want to go beyond just batting average, these sites provide a treasure trove of other statistics as well, including on-base percentage, slugging percentage, and the combined OPS, among others. You can even delve into advanced metrics like WAR (Wins Above Replacement) or wRC+ (Weighted Runs Created Plus) if you're feeling particularly ambitious.
In conclusion, the batting average, despite some of the debates surrounding it, remains a central part of baseball. It's a statistic that links the present day to the earliest days of professional baseball, and it continues to be a key measure of a hitter's success at the plate.
Even as we embrace more complex and nuanced metrics in the modern era, the batting average remains a steadfast part of baseball's statistical tapestry. Whether you're scanning the box scores in the newspaper or looking up the latest stats online, the batting average provides a simple, straightforward snapshot of a player's ability to do one of the most fundamental things in the sport: get a hit.
So the next time you're watching a game, or discussing the latest performances with fellow fans, you'll be able to talk about batting averages with a deeper understanding of what it represents, how it's calculated, and where it fits within the rich, complex world of baseball statistics.
Thank you so much for reading, and I hope you found this article helpful! Keep learning, keep asking questions, and most importantly, keep enjoying the wonderful game of baseball. After all, you're not just a baseball fan - you're a baseball aficionado now.
Until next time, keep your eye on the ball!
Chris Sloan is a former baseball league commissioner and travel baseball coach who has made significant contributions to the sport. In 2018, he founded selectbaseballteams.com, a website that helps parents find youth and travel baseball teams in their local areas. Since its launch, the website has experienced impressive growth, offering a wealth of resources including teams, news, tournaments, and organizations. Chris's unwavering passion for baseball and his innovative approach to connecting parents with quality baseball programs have earned him a respected reputation in the baseball community, solidifying his legacy as a leading figure in the world of youth and travel baseball.
There are 0 comments on "What is Batting Average in Baseball & Why does it Matter?"


chandler allen says:
"Hi my name is chandler, i’ve enjoyed..."
On Wanting to tryout for summer ball. as an 18 year old
david graham says:
"With no current MLB team in Canada,..."
On With no current MLB team in
Charles Chavez says:
"To All Coaches: Do you have13U or..."
On Looking for Games